
The Market (1973-2019)

Stock Market Contractions and Expansions
The stock market moves in cycles with periods of contraction followed by periods of expansion. There have been eight market downturns in the past 47 years. The regions shaded in orange highlight a contraction phase of a stock market cycle, and the green regions show an expansion phase. A contraction is defined by a period when the stock market value declined from its peak by 10% or more. These declines seem to happen at random and last for varying time periods. Expansion measures the recovery of the index from the bottom of a contraction to its previous peak and the subsequent performance of the index until it reaches the next peak level before another 10% decline.
The last contraction (associated with trade war with China and rising interest rates) began in October 2018 and ended in December 2018. The stock market recovered from this crisis in April 2019.
While some periods of decline have been severe, the market, overall, has grown with time. For instance, the stock market fell by 14.7% from its peak at month-end May 1990 to its trough in October 1990 but grew by 355.1% from November 1990 to its next peak in June 1998. No one can predict market declines with certainty. Investors should have a long-term investment horizon to allow their investment to grow over time. Returns and principal invested in stocks are not guaranteed.
About the data
Large stocks are represented by the Ibbotson® Large Company Stock Index. An investment cannot be made directly in an index. The data assumes reinvestment of all income and does not account for taxes or transaction costs.
Crisis and Long-Term Performance (1970-2019)

Economies and markets tend to move in cycles, and any stock market can have a downturn once in a while. Most investors lose money when the stock market goes down, but some people may think they can time the market and gain. For example, an investor may aim to buy in when the market is at the very bottom and cash out when the recovery is complete, thus enjoying the entire upside.
The problem with this type of reasoning is that it’s impossible to know when the market hits bottom. Most investors panic when the market starts to decline, then they decide to wait and end up selling after they have already lost considerable value. Or, on the recovery side, they buy in after the initial surge in value has passed and miss most of the upward momentum. The graph illustrates the growth of USD 1 invested in U.S. large stocks at the beginning of 1970 and the four major market declines that subsequently occurred, including the recent banking and credit crisis. Panic is understandable in times of market turmoil, but investors who flee in such moments may come to regret it.
Each crisis, when it happens, feels like the worst one ever (the most recent one, as evidenced by the image, actually was). When viewed in isolation on the lower-tier graphs, each decline appears disastrous. However, historical data suggests that holding on through difficult times can pay off in the long run. For example, USD 1 invested in January 1970 grew to USD $153.91 by December 2019, generating a 10.6% compound annual return. And in the past, when looking at the big picture, every crisis has been eclipsed by long-term growth.
Returns and principal invested in stocks are not guaranteed.
Market Downturn and Recoveries (1926-2019)
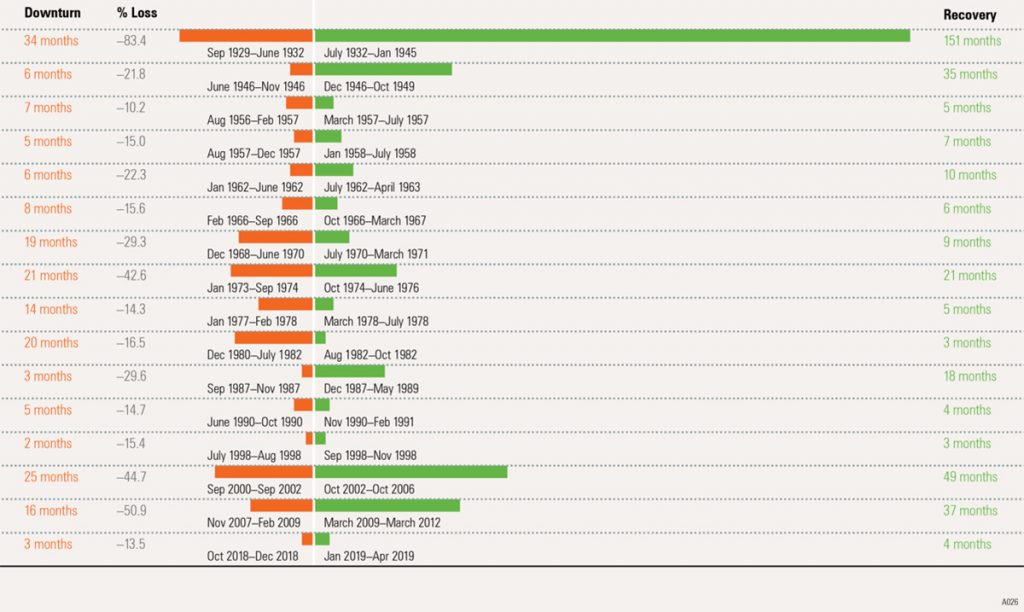
A historical account of past downturns and recoveries can present a better picture of potential market performance. There have been many U.S. equity market downturns over time, with varying levels of severity and differing lengths of recovery. The most severe downturn marked the start of the Great Depression, when stocks lost over 80% of their value. In this case, the recovery period was over 12 years.
More recently, stocks lost 44.7% of their value during the early-2000s bear market. This recovery period, lasting four years, was the second-longest in history. Stocks lost 50.9% during the recent 2007–09 bear market; this downturn lasted for 16 months, and the stock market recovered after 37 months, in March 2012.
It is evident that stocks are prone to sudden declines in value. These declines seem to happen at random, and there are many different reasons for stock market crashes and bear markets. Sometimes stocks recover their value quickly, while other times the decline lasts for a while.
The recovery period may be painfully long. Often, the decline is preceded by a period of high returns, which lulls investors into a false sense of security. Because no one can predict market declines with certainty, a diversified portfolio may be the best solution for a long–term investor who is concerned about both return and risk.
Returns and principal invested in stocks are not guaranteed. Diversification does not eliminate the risk of investment losses.
Periods of Consecutive Negative Returns (1926-2019)

Ceasing regular investments during market downturns can sometimes deprive you of future opportunities.
The image illustrates that since 1926 there have been four times when the market failed to reach returns above zero for two or more consecutive years. In all four instances, negative returns have been followed by above-average positive returns. This pattern is not guaranteed to repeat itself, but it illustrates the market’s potential and one of the reasons to stay focused on your investment plan.
A disciplined investment approach is still one of the best strategies for handling market downturns. This includes maintaining a well-diversified portfolio and using dollar-cost averaging, instead of lump-sum purchases, to ease into new investments. Finally, staying focused on a long-term investment plan may enable investors to participate in recoveries.
Diversification does not eliminate the risk of investment losses. Dollar-cost averaging does not ensure a profit or protect against a loss in declining markets. Dollar-cost averaging involves continuous investment regardless of fluctuating prices, so investors should consider their financial ability to continue purchases through periods of low price levels. Stocks are not guaranteed and have been more volatile than other asset classes.
The importance of staying invested

Investors who attempt to time the market run the risk of missing periods of exceptional returns, leading to significant adverse effects on the ending value of a portfolio.
The image illustrates the value of a USD 100,000 investment in the stock market during the 2007–19 period, which included the global financial crisis and the recovery that followed. The value of the investment dropped to USD 54,381 by February 2009 (the trough date), following a severe market decline.
If an investor remained invested in the stock market over the next ten years, however, the ending value of the investment would have been USD 299,780. If the same investor exited the market at the bottom, invested in cash for a year, and then reinvested in the market, the ending value of the investment would have been USD 195,315. An all-cash investment at the bottom of the market would have yielded only USD 57,320. The continuous stock market investment recovered its initial value over the next three years and provided a higher ending value than the other two strategies. While all recoveries may not yield the same results, investors are well advised to stick with a long-term approach to investing.
Returns and principal invested in stocks are not guaranteed. Stocks have been more volatile than bonds or cash. Holding a portfolio of securities for the long term does not ensure a profitable outcome and investing in securities always involves risk of loss.
This document has been prepared by Forrest Private Wealth Pty Ltd ABN 12 615 181 881 Corporate Authorised Representative of Forrest Private Wealth Management Pty Ltd ABN 18 615 339 485 AFSL No. 492712. It is general information only and not intended to provide you with financial advice or take into account your objectives, financial situation or needs. You should consider this in consultation with one of our Financial Advisors, whether the information is suitable to your circumstances. To the extent permitted by law, no liability is accepted for any loss or damage as a result of reliance on this information.
For more information please contact Forrest Private Wealth.